VizMAP
VizMAP is a visualization module that is available as an optional add-on to Patent iNSIGHT Pro for users who seek advanced visualizations above charts and graphs for semantic exploration within large sets of patent data. VizMAP highly leverages the capability of the human visual system to identify patterns and anomalies when information is presented in an intuitive visual landscape.
Why VizMAP
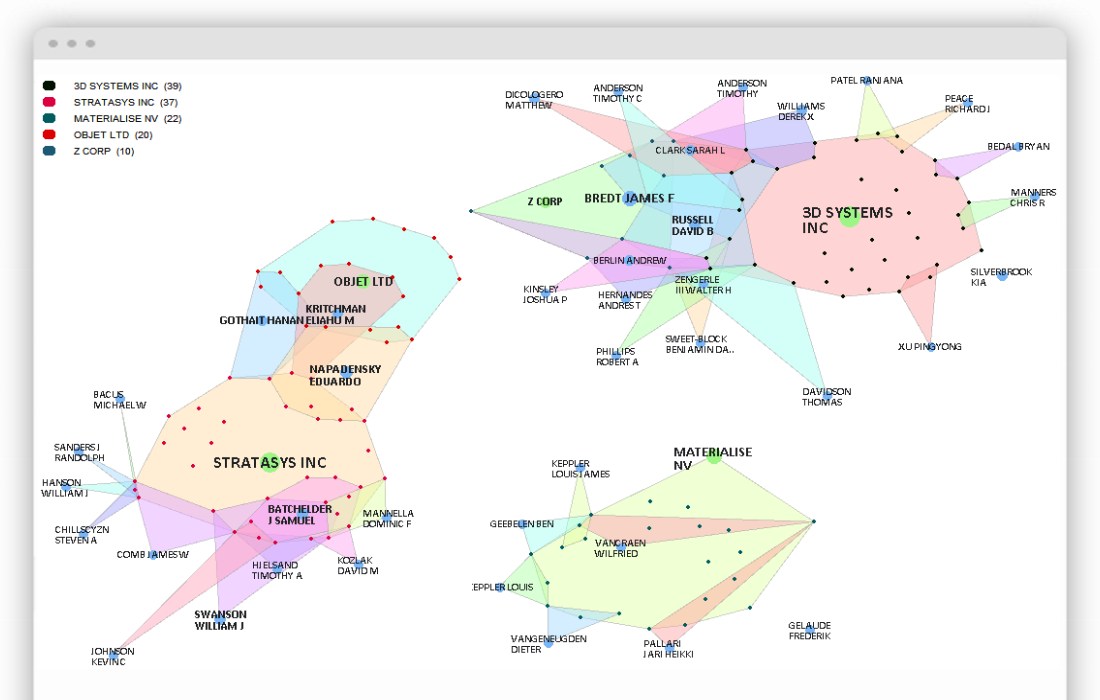
VizMAP is unique from existing solutions in that it combines patent network analysis with semantic (contextual) spatial-mapping thereby allowing users to not just view clusters and their contents but analyze key relationships in their context. Interactive maps generated in VizMAP can be shared with non-users too.
VizMAP can help you:
Conduct in-depth competitor portfolio analysis
Locate areas of risk and opportunity within your technology area
Predict trends and refine R&D strategy
Gather intelligence required for your M&A activities
Three different modes of analysis – Network Mode, Context Mode and Co-Citation Mode help you visually analyze patent relationships, patent text and patent citations respectively.
VizMAP – Key Visualization Features
VizMAP allows you to visually explore key semantic clusters represented in a two-dimensional landscape built with many powerful but intuitive capabilities such as:
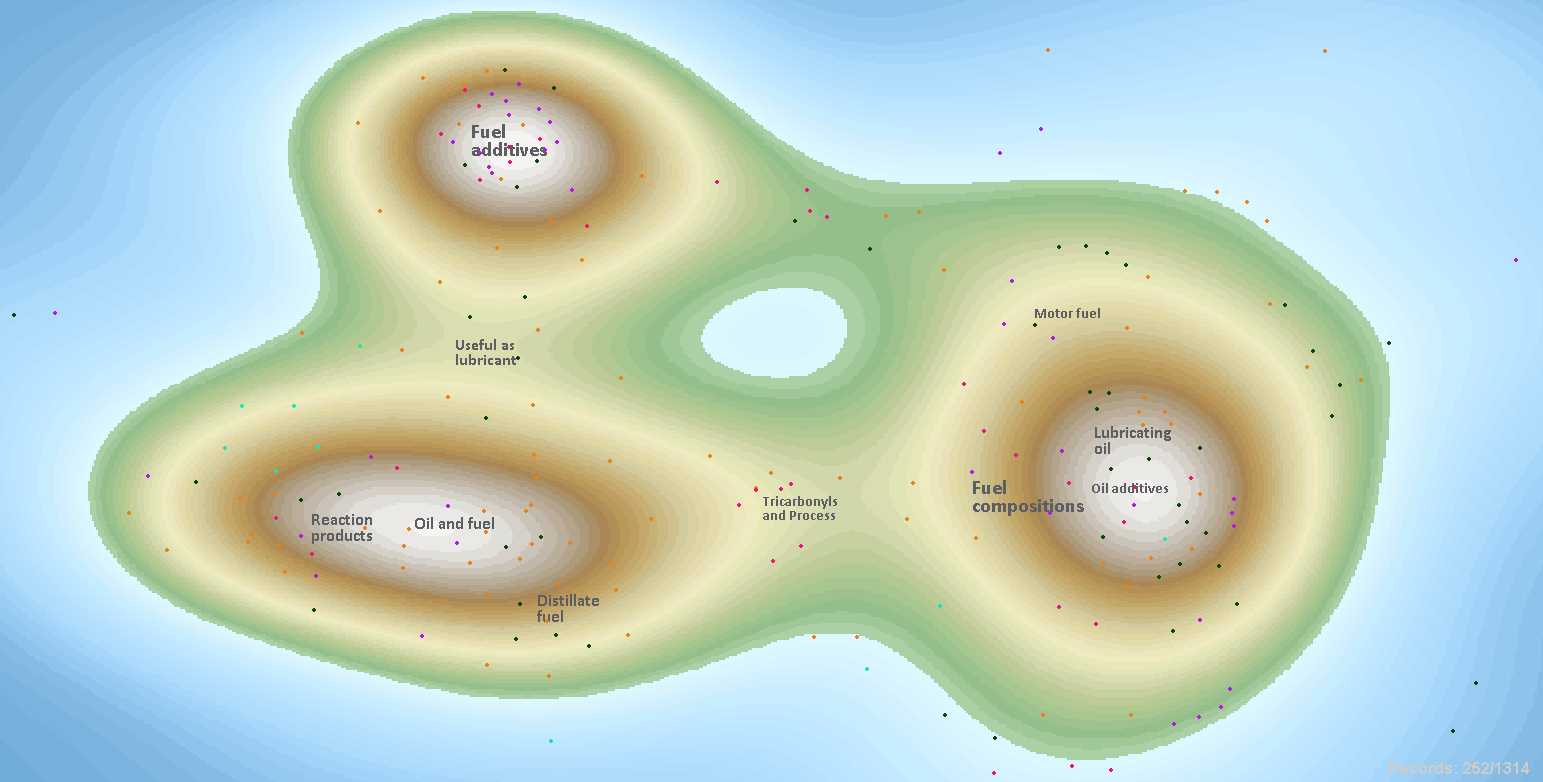
Generate Contour maps for technology landscaping. See sample of such maps below:
Using simple mouse operations you can dissect each cluster not just by contextual relationships but also by companies, inventors, classification codes and others
You can define your own custom clusters and categories and investigate relationships from there
Temporal analysis capabilities are built-in and you can time-slice the visualization to reflect a particular period
Important clusters and properties are designated by the size of the halo behind it
Higher referenced patents can be highlighted within any visualization by a single click
Unique “Map-view” operation allows you to take a 30000 ft view and then zoom into smaller clusters around the bigger ones
You can conduct Advanced Boolean searches and highlight results on the visualization
Unique mouse-over operations allow you to quickly determine direct relationships between each property
VizMAP Viewer – Using the VizMAP viewer you can practically share a map that you prepare with anyone.The recipient views exactly the same map with full interactivity such as mouse-over details, zoom, search and highlight allowing him or her to understand, interpret and derive much more from the map.
Sample Use case Scenarios with VizMAP

See how visual analysis with VizMAP can aid your analysis activities:

